PL. 33 · COLOUR / INTERPOLATION / POLYNOMIAL
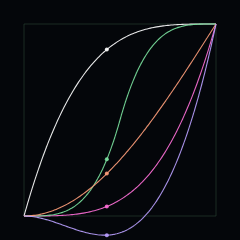
Easing Curves
Robert Penner, 2001 · the polynomials are older
OPEN THE LIVE PLATE ▸DEFINITION
quad  f(t) = t²
cubic f(t) = t³
sine  f(t) = 1 − cos(πt/2)
expo  f(t) = 2^(10(t−1))
NOTES
The interpolation curves that make motion read as physical rather than mechanical. Penner catalogued and named them for Flash designers in 2001; the underlying functions are just polynomials and trigonometry, some of them centuries old. The names stuck so thoroughly that they are now effectively an interface standard.
PROVENANCE
- Origin
- Named set popularised by Robert Penner, 2001
- Standing
- The functions are elementary mathematics — public domain
- Constants
- Every curve here passes through (0,0) and (1,1)
HOUDINI · VEX
The same published mathematics as a Detail Wrangle body. Paste it into a Wrangle with Run Over set to Detail; every constant is the published value plus a tweak channel, so Create Spare Parameters gives a slider that starts where the paper does.
// FORMA — PL. 33 · EASING CURVES — Robert Penner, 2001 · the polynomials are older
//   quad  f(t) = t²
//   cubic f(t) = t³
//   sine  f(t) = 1 − cos(πt/2)
//   expo  f(t) = 2^(10(t−1))
// Paste into a Detail Wrangle (Run Over: Detail), no inputs needed.
// Written from the published mathematics, not adapted from any code.
// Constants arrive at their published values. Press the node's Create
// Spare Parameters button and every tweak becomes a slider — starting
// at 0, the published figure, and moving in the constant's own units.
// https://forma-gen.com/#plate=easing

float p_power = 6 + chf('power_tweak');       // polynomial power — sweep ceiling · live 1.5 .. 9
float p_back  = 1.7 + chf('back_tweak');      // overshoot · live 0 .. 3

// The plate's own colour: FORMA's COLOUR accent as a cosine ramp,
// brightest near t = 0 and t = 1, near-black around t = 0.5.
vector forma_ramp(float t){
  return set(
    0.46 + 0.5 * cos(6.28318530718 * (t + 0)),
    0.2002 + 0.2176 * cos(6.28318530718 * (t + 0.05)),
    0.3896 + 0.4235 * cos(6.28318530718 * (t + 0.1)));
}

// Penner's catalogue as plotted curves: ease-in, ease-out and ease-in-out on
// the polynomial, the sine ease, and the back ease with its overshoot. Each
// is a polyline through the plate's own 121 samples in the unit box, y
// negated onto Houdini's up so "easing in" still rises to the right.
//
// The plate breathes its exponent from 1 up to the slider's ceiling and
// back on a 16-second pingpong, and runs a playhead dot along every curve —
// both are clock animation a cook does not have. The exponent is frozen at
// the ceiling, which is the number the slider names ("sweep ceiling"), and
// the playhead is not ported. Curve colours: the plate draws the first two
// in the page's accent and contrast marks, which a port bakes as the ramp's
// own brightest steps; the last three are the plate's own literal channel
// colours.
int forma_samples = 120;

float power = p_power;
float bk = p_back;

for (int c = 0; c < 5; c++){
    vector col;
    if      (c == 0) col = forma_ramp(0.0);                  // TRACE — the accent itself
    else if (c == 1) col = forma_ramp(0.92);                 // HILITE's role: the bright mark
    else if (c == 2) col = set(0.482, 0.890, 0.627);         // #7BE3A0
    else if (c == 3) col = set(1.000, 0.620, 0.478);         // #FF9E7A
    else             col = set(0.725, 0.627, 1.000);         // #B9A0FF
    int prim = addprim(0, "polyline");
    for (int s = 0; s <= forma_samples; s++){
        float u = float(s) / float(forma_samples);
        float f;
        if      (c == 0) f = pow(u, power);                              // ease in
        else if (c == 1) f = 1.0 - pow(1.0 - u, power);                  // ease out
        else if (c == 2) f = u < 0.5 ? pow(2.0 * u, power) / 2.0         // in-out
                                     : 1.0 - pow(2.0 - 2.0 * u, power) / 2.0;
        else if (c == 3) f = 1.0 - cos(u * M_PI / 2.0);                  // sine
        else             f = u * u * ((bk + 1.0) * u - bk);              // back, overshooting
        // the plate clamps the overshoot to its own quarter-frame of air
        f = min(1.25, max(-0.25, f));
        // canvas y runs down and the plate flips f onto it; Houdini's y is
        // already up, so f plots directly and the curves rise to the right
        int pt = addpoint(0, set(u, f, 0.0));
        setpointattrib(0, "Cd", pt, col);
        setpointattrib(0, "Alpha", pt, 0.9);
        addvertex(0, prim, pt);
    }
}
AFTER EFFECTS · EXPRESSION
The same published mathematics as a Shape Layer path expression. Paste it onto a Path property; every constant is the published value plus a Slider Control named
// FORMA — PL. 33 · EASING CURVES — Robert Penner, 2001 · the polynomials are older
//   quad  f(t) = t²
//   cubic f(t) = t³
//   sine  f(t) = 1 − cos(πt/2)
//   expo  f(t) = 2^(10(t−1))
// After Effects port — paste onto a Shape Layer's Path property
// (Contents › Shape › Path). Written from the published mathematics, not
// adapted from any code. Constants arrive at their published values; add a
// Slider Control (Effect › Expression Controls) named <k>_tweak and that
// constant moves in its own units, starting at 0 — the published figure.
// The plate's comet and its reveal are Trim Paths; the stroke colour is
// FORMA's COLOUR accent, #FF6FD8. Animation runs on time.
// This plate draws 6 separate paths at its published constants:
// duplicate the group (Contents › Group) that many times and each copy draws
// its own part, read from its position in the layer. A Slider Control named
// "part" on the layer pins one instead.
// https://forma-gen.com/#plate=easing

// A missing slider reads 0, so a bare paste already draws the figure.
function forma_tweak(n){ try { return effect(n)("Slider"); } catch (e){ return 0; } }
var p_power = 6 + forma_tweak("power_tweak");     // polynomial power — sweep ceiling · live 1.5 .. 9
var p_back  = 1.7 + forma_tweak("back_tweak");    // overshoot · live 0 .. 3

// The frame: the plate's W × H canvas is this comp, with the origin at the
// layer's anchor; canvas y already runs down, as After Effects' does.
var forma_W = thisComp.width, forma_H = thisComp.height, forma_t = time;
var forma_phase = 0.698725682683289;   // this plate's own fixed phase, as the page has it
function forma_pt(x, y){ return [x - forma_W / 2, y - forma_H / 2]; }
function forma_partIndex(){
  try { return Math.round(effect("part")("Slider")); } catch (e){}
  try { return thisProperty.propertyGroup(3).propertyIndex - 1; } catch (e){ return 0; }
}
var forma_part = forma_partIndex();

// Five easing curves over the unit square, as the page draws them: ease-in
// u^n, ease-out 1 − (1 − u)^n, ease-in-out, the sine ease 1 − cos(πu/2), and
// the back ease u²((s + 1)u − s) with its overshoot s. The exponent breathes
// from linear up to the slider's power and back over 16 s — the slider is the
// ceiling, not a fixed exponent — so the curves stay alive. Plotted values
// are clamped to −0.25 .. 1.25 as on the page, so the overshoot reads without
// leaving the frame. One curve per part, 0 .. 4, each in its own colour on
// the page (the accent, the contrast mark, mint, coral, lavender); part 5 is
// the unit square itself. The travelling dot is Trim Paths with Start = End.
// parts: 6
var m = Math.min(forma_W, forma_H) * 0.1, bw = forma_W - m * 2, bh = forma_H - m * 2;
var u16 = ((forma_t / 16) + forma_phase) % 1, tri = u16 < 0.5 ? u16 * 2 : 2 - u16 * 2;
var power = 1 + tri * (p_power - 1);
function forma_ease(i, u){
  if (i === 0) return Math.pow(u, power);
  if (i === 1) return 1 - Math.pow(1 - u, power);
  if (i === 2) return u < 0.5 ? Math.pow(2 * u, power) / 2 : 1 - Math.pow(2 - 2 * u, power) / 2;
  if (i === 3) return 1 - Math.cos(u * Math.PI / 2);
  return u * u * ((p_back + 1) * u - p_back);
}
var pts = [];
if (forma_part >= 5){
  pts.push(forma_pt(m, m), forma_pt(m + bw, m), forma_pt(m + bw, m + bh), forma_pt(m, m + bh));
  createPath(pts, [], [], true);
} else {
  for (var s = 0; s <= 120; s++){
    var u = s / 120, v = forma_ease(forma_part, u);
    v = Math.min(1.25, Math.max(-0.25, v));
    pts.push(forma_pt(m + u * bw, m + bh - v * bh));
  }
  createPath(pts, [], [], false);
}