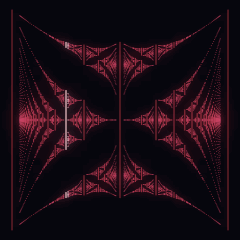
PL. 96 · FRACTALS / SPECTRUM / RATIONAL FLUX
Hofstadter Butterfly
Douglas R. Hofstadter, 1976 · Harper’s equation, P. G. Harper, 1955
OPEN THE LIVE PLATE ▸DEFINITION
ψₘ₊₁ + ψₘ₋₁ + λ·cos(2πφm + k_y)·ψₘ = E·ψₘ
φ = p/q:  tr Mq(E, k_y) = P(E) − 2(λ/2)^q·cos(q k_y)
spectrum ⇔ |P(E)| ≤ 2 + 2(λ/2)^q
NOTES
Put a crystal in a magnetic field and the answer turns on whether the flux through one cell is a rational multiple of the flux quantum — not nearly rational, exactly rational. At p/q the allowed energies collapse into q bands; move the field a hair and q jumps to something unrelated, so the spectrum is discontinuous in the field everywhere. Plot it anyway, energy against flux, and the discontinuity resolves into a figure that contains scaled copies of itself all the way down. Hofstadter had it in 1976 as a computed plot with nothing in the laboratory to check it against: an ordinary lattice needs thousands of tesla to reach one flux quantum a cell. It took until 2013 and a moiré superlattice — graphene laid on boron nitride, cells hundreds of times larger — for anyone to measure one. Every mark here is a band edge solved for, not an escape-time count.
PROVENANCE
- Origin
- D. R. Hofstadter, "Energy levels and wave functions of Bloch electrons in rational and irrational magnetic fields", Physical Review B 14(6), 15 September 1976, 2239–2249
- The equation
- P. G. Harper, "Single band motion of conduction electrons in a uniform magnetic field", Proceedings of the Physical Society A 68(10), 1955, 874–878. Hofstadter’s contribution is the two-dimensional plot and the recursive structure read out of it, not the difference equation
- Predicted first
- M. Ya. Azbel, "Energy spectrum of a conduction electron in a magnetic field", Soviet Physics JETP 19(3), 1964, 634–645, cited by Hofstadter, already had the continued-fraction hierarchy of the spectrum in one dimension. Hofstadter plotted every flux against every energy, and that is where the figure is
- The method drawn here
- W. G. Chambers, "Linear-Network Model for Magnetic Breakdown in Two Dimensions", Physical Review 140(1A), 1965, A135, gives the rational-flux band condition as a trace: the q-step transfer matrix of Harper’s equation has trace P(E) − 2(λ/2)^q·cos(q k_y), with P a polynomial in E alone. Bloch’s |trace| ≤ 2 over every transverse momentum then collapses to |P(E)| ≤ 2 + 2(λ/2)^q, which is one q-step matrix product per energy and no eigenvalue solve at all
- The coupling
- S. Aubry and G. André, "Analyticity breaking and Anderson localization in incommensurate lattices", Annals of the Israel Physical Society 3, 1980, 133. λ = 2t_y/t_x is the hopping anisotropy; λ = 2 is Hofstadter’s isotropic square lattice
- Measured at last
- Three groups reported it within weeks in 2013, all on graphene–boron nitride moiré superlattices: C. R. Dean et al., Nature 497, 598–602; L. A. Ponomarenko et al., Nature 497, 594–597; B. Hunt et al., Science 340, 1427–1430
- Standing
- Public domain — a difference equation and its spectrum
- Constants
- λ stops at 2 because Aubry–André duality makes everything above it a repeat: measured at rational flux, the spectrum at λ is exactly λ/2 times the spectrum at 4/λ, and this plate’s energy axis is scaled by the operator’s own bound 2 + λ, so λ = 3 and λ = 4/3 draw the identical picture. Q is the denominator ceiling and it governs the whole cost — the atlas default resolves the wings and the first two levels of the recursion inside the frame budget
- Source
- doi:10.1103/PhysRevB.14.2239
HOUDINI · VEX
The same published mathematics as a Detail Wrangle body. Paste it into a Wrangle with Run Over set to Detail; every constant is the published value plus a tweak channel, so Create Spare Parameters gives a slider that starts where the paper does.
// FORMA — PL. 96 · HOFSTADTER BUTTERFLY — Douglas R. Hofstadter, 1976 · Harper’s equation, P. G. Harper, 1955
//   ψₘ₊₁ + ψₘ₋₁ + λ·cos(2πφm + k_y)·ψₘ = E·ψₘ
//   φ = p/q:  tr Mq(E, k_y) = P(E) − 2(λ/2)^q·cos(q k_y)
//   spectrum ⇔ |P(E)| ≤ 2 + 2(λ/2)^q
// Paste into a Detail Wrangle (Run Over: Detail), no inputs needed.
// Written from the published mathematics, not adapted from any code.
// Constants arrive at their published values. Press the node's Create
// Spare Parameters button and every tweak becomes a slider — starting
// at 0, the published figure, and moving in the constant's own units.
// https://forma-gen.com/#plate=hofstadter

float p_qmax = 28 + chf('qmax_tweak');      // Q — largest denominator · live 12 .. 50
float p_lam  = 2 + chf('lam_tweak');        // λ — hopping anisotropy · live 1 .. 2

// The plate's own colour: FORMA's FRACTALS accent as a cosine ramp,
// brightest near t = 0 and t = 1, near-black around t = 0.5.
vector forma_ramp(float t){
  return set(
    0.46 + 0.5 * cos(6.28318530718 * (t + 0)),
    0.1389 + 0.151 * cos(6.28318530718 * (t + 0.05)),
    0.1912 + 0.2078 * cos(6.28318530718 * (t + 0.1)));
}

// The butterfly by Chambers's trace relation, exactly as the plate solves
// it: at rational flux p/q the q-step transfer matrix of Harper's equation
// has trace P(E) − 2(λ/2)^q·cos(q·k_y) with P independent of k_y, so
// evaluating at the k_y where the cosine vanishes returns P itself, and the
// spectrum is |P(E)| ≤ 2 + 2(λ/2)^q — one matrix product per energy sample
// and no eigenvalue solve anywhere. One quarter of the figure is computed
// and mirrored out through the plate's own two exact symmetries (E → −E,
// φ → 1 − φ); band edges are bisected to 2·10⁻⁵ as the plate bisects them.
// Every band is a vertical two-point prim at x = φ, coloured by denominator
// — coarse fractions brightest, the whole span inside the bright lobe. The
// plate's sweeping HILITE reading head is the animation's, not the
// spectrum's. Deterministic by construction — nothing here is random.
float forma_eps = 1e-4;           // floor on a band's height, so no prim is zero-length

function float forma_hb_trace(float E; float pot[]; int q){
    float a = 1.0, b = 0.0, c = 0.0, d = 1.0;
    for (int m = 0; m < q; m++){
        // left-multiply by [[E − λcos(2πφm + k_y), −1], [1, 0]]
        float v = E - pot[m];
        float na = v * a - c, nb = v * b - d;
        c = a;  d = b;  a = na;  b = nb;
    }
    return a + d;
}
function float forma_hb_edge(float a, b, target; float pot[]; int q){
    float lo = a, hi = b;
    float sgn = forma_hb_trace(lo, pot, q) - target;
    for (int i = 0; i < 18; i++){
        float m = (lo + hi) / 2.0;
        if ((forma_hb_trace(m, pot, q) - target) * sgn > 0.0) lo = m;
        else hi = m;
    }
    return (lo + hi) / 2.0;
}

int Q = int(rint(p_qmax));
float lam = p_lam;
float top = 2.0 + lam;            // ‖H‖ ≤ 2t_x + 2t_y: the axis is the operator's own bound

for (int q = 1; q <= Q; q++){
    vector col = forma_ramp(1.06 - 0.22 * float(q - 1) / float(Q));
    for (int pn = 0; pn * 2 <= q; pn++){
        // reduced fractions with φ ≤ 1/2 — one quarter of the butterfly is all of it
        int gx = pn, gy = q;
        while (gy != 0){ int tg = gy;  gy = gx % gy;  gx = tg; }
        if (gx != 1) continue;
        float ky = M_PI / (2.0 * float(q));
        float lim = 2.0 + 2.0 * pow(lam / 2.0, q);
        float pot[];
        resize(pot, q);
        for (int m = 0; m < q; m++)
            pot[m] = lam * cos(2.0 * M_PI * float(pn) * float(m) / float(q) + ky);

        // scan the upper half-axis for sign structure; a band thinner than a
        // step is still caught because P must cross the whole strip over it
        float band[];
        int NS = 40 * q;
        float e0 = 0.0, p0 = forma_hb_trace(0.0, pot, q);
        float open = -1.0;
        int isopen = abs(p0) <= lim ? 1 : 0;
        if (isopen) open = 0.0;
        for (int i = 1; i <= NS; i++){
            float e1 = (top + 0.05) * float(i) / float(NS);
            float p1 = forma_hb_trace(e1, pot, q);
            int inside = abs(p1) <= lim ? 1 : 0;
            if (!isopen && (inside || p0 * p1 < 0.0)){
                open = forma_hb_edge(e0, e1, p0 > 0.0 ? lim : -lim, pot, q);
                isopen = 1;
            }
            if (isopen && !inside){
                push(band, open);
                push(band, forma_hb_edge(e0, e1, p1 > 0.0 ? lim : -lim, pot, q));
                isopen = 0;
            }
            e0 = e1;  p0 = p1;
        }
        if (isopen){ push(band, open);  push(band, top); }

        // emit at φ and 1 − φ, each band mirrored about E = 0
        float phis[];
        push(phis, float(pn) / float(q));
        if (pn * 2 != q) push(phis, 1.0 - float(pn) / float(q));
        foreach (float phi; phis){
            for (int k = 0; k < len(band); k += 2){
                float lo = band[k], hi = max(band[k + 1], band[k] + forma_eps);
                for (int s = 0; s < 2; s++){
                    float y0 = s ? -hi : lo, y1 = s ? -lo : hi;
                    if (s && lo <= 0.0) continue;        // a band across zero is one prim
                    if (!s && lo <= 0.0){ y0 = -hi;  y1 = hi; }
                    int b0 = addpoint(0, set(phi, y0, 0.0));
                    int b1 = addpoint(0, set(phi, y1, 0.0));
                    setpointattrib(0, "Cd", b0, col);  setpointattrib(0, "Cd", b1, col);
                    setpointattrib(0, "Alpha", b0, 0.86);  setpointattrib(0, "Alpha", b1, 0.86);
                    addprim(0, "polyline", b0, b1);
                }
            }
        }
    }
}
AFTER EFFECTS · DECLINED
A spectrum is a set, not a curve: thousands of disconnected hairline bands, and one band per copy of the group is not a port anyone would use.