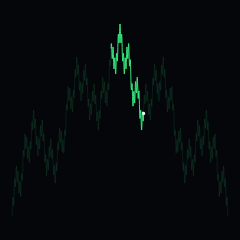
PL. 69 · CURVES / SERIES / PATHOLOGICAL
Weierstrass Function
Karl Weierstrass, 1872 · G. H. Hardy, 1916
OPEN THE LIVE PLATE ▸DEFINITION
W(x) = Σ aⁿ cos(bⁿ π x)
0 < a < 1, b odd integer, ab > 1 + 3π/2  (Weierstrass, 1872)
0 < a < 1, b real, ab ≥ 1  (Hardy, 1916)
continuous everywhere · differentiable nowhere
NOTES
The function that ended the belief that a continuous curve must have a tangent somewhere — Weierstrass read it to the Berlin Academy and the century’s geometers called it a scandal. Every term is a smooth cosine; the sum has a corner at every point. Weierstrass needed b to be an odd integer and ab past 1 + 3π/2; Hardy pulled both away, leaving ab ≥ 1 for real b, and that is the condition on the plate. What the canvas shows is necessarily a partial sum, because any finite sum is smooth and the pathology lives only in the limit — terms whose frequency passes the pixel grid are dropped, since past that they alias into noise the mathematics never contained.
PROVENANCE
- Origin
- K. Weierstrass, read to the Königlich Preussische Akademie der Wissenschaften, Berlin, 18 July 1872 — recorded in the Monatsberichte for 1872, p. 560; G. H. Hardy, "Weierstrass’s non-differentiable function", Trans. AMS 17 (1916), 301–325, dropped the odd-integer requirement on b and weakened ab > 1 + 3π/2 to ab ≥ 1
- Standing
- Public domain — 19th-century analysis
- Constants
- The term count is set by resolution, not by a dial: a finite sum is smooth, so more terms than the pixels resolve would claim a depth the plate cannot show. Both sliders stay inside Hardy’s condition across their whole range — the weakest corner, a = 0.34 against b = 3, still gives ab = 1.02
HOUDINI · VEX
The same published mathematics as a Detail Wrangle body. Paste it into a Wrangle with Run Over set to Detail; every constant is the published value plus a tweak channel, so Create Spare Parameters gives a slider that starts where the paper does.
// FORMA — PL. 69 · WEIERSTRASS FUNCTION — Karl Weierstrass, 1872 · G. H. Hardy, 1916
//   W(x) = Σ aⁿ cos(bⁿ π x)
//   0 < a < 1, b odd integer, ab > 1 + 3π/2  (Weierstrass, 1872)
//   0 < a < 1, b real, ab ≥ 1  (Hardy, 1916)
//   continuous everywhere · differentiable nowhere
// Paste into a Detail Wrangle (Run Over: Detail), no inputs needed.
// Written from the published mathematics, not adapted from any code.
// Constants arrive at their published values. Press the node's Create
// Spare Parameters button and every tweak becomes a slider — starting
// at 0, the published figure, and moving in the constant's own units.
// https://forma-gen.com/#plate=weierstrass

float p_a = 0.55 + chf('a_tweak');    // a — amplitude ratio · live 0.34 .. 0.68
float p_b = 5 + chf('b_tweak');       // b — frequency ratio · live 3 .. 9

// The plate's own colour: FORMA's CURVES accent as a cosine ramp,
// brightest near t = 0 and t = 1, near-black around t = 0.5.
vector forma_ramp(float t){
  return set(
    0.11 + 0.1196 * cos(6.28318530718 * (t + 0)),
    0.46 + 0.5 * cos(6.28318530718 * (t + 0.05)),
    0.2453 + 0.2667 * cos(6.28318530718 * (t + 0.1)));
}

// Continuous everywhere, differentiable nowhere. Depth is bounded by what
// the samples can hold: bⁿ stays under a quarter of the sample count so the
// top term still renders as oscillation rather than aliasing into noise the
// mathematics never contained — the plate's own ceiling.
int forma_n = 1600;

int terms = max(2, int(floor(1.0 + log(float(forma_n) / 4.0) / log(p_b))));
// Σ|aⁿ| — normalising by it keeps every (a, b) on the same amplitude
float norm = (1.0 - pow(p_a, terms)) / (1.0 - p_a);
int prim = addprim(0, "polyline");
for (int i = 0; i <= forma_n; i++){
    float x = float(i) / float(forma_n) * 2.0 - 1.0;
    float y = 0.0;
    for (int k = 0; k < terms; k++)
        y += pow(p_a, k) * cos(pow(p_b, k) * 3.14159265359 * x);
    // the graph is drawn y-up already; no flip needed
    int pt = addpoint(0, set(x, y / norm, 0.0));
    // colour sweeps the bright lobe of the ramp along the graph
    float u = float(i) / float(forma_n);
    setpointattrib(0, "Cd", pt, forma_ramp(0.8 + 0.3 * u));
    addvertex(0, prim, pt);
}
AFTER EFFECTS · EXPRESSION
The same published mathematics as a Shape Layer path expression. Paste it onto a Path property; every constant is the published value plus a Slider Control named
// FORMA — PL. 69 · WEIERSTRASS FUNCTION — Karl Weierstrass, 1872 · G. H. Hardy, 1916
//   W(x) = Σ aⁿ cos(bⁿ π x)
//   0 < a < 1, b odd integer, ab > 1 + 3π/2  (Weierstrass, 1872)
//   0 < a < 1, b real, ab ≥ 1  (Hardy, 1916)
//   continuous everywhere · differentiable nowhere
// After Effects port — paste onto a Shape Layer's Path property
// (Contents › Shape › Path). Written from the published mathematics, not
// adapted from any code. Constants arrive at their published values; add a
// Slider Control (Effect › Expression Controls) named <k>_tweak and that
// constant moves in its own units, starting at 0 — the published figure.
// The plate's comet and its reveal are Trim Paths; the stroke colour is
// FORMA's CURVES accent, #3DFF88. Animation runs on time.
// https://forma-gen.com/#plate=weierstrass

// A missing slider reads 0, so a bare paste already draws the figure.
function forma_tweak(n){ try { return effect(n)("Slider"); } catch (e){ return 0; } }
var p_a = 0.55 + forma_tweak("a_tweak");  // a — amplitude ratio · live 0.34 .. 0.68
var p_b = 5 + forma_tweak("b_tweak");     // b — frequency ratio · live 3 .. 9

// The frame: the plate's W × H canvas is this comp, with the origin at the
// layer's anchor; canvas y already runs down, as After Effects' does.
var forma_W = thisComp.width, forma_H = thisComp.height, forma_t = time;
var forma_phase = 0.22420714446343482;   // this plate's own fixed phase, as the page has it
function forma_pt(x, y){ return [x - forma_W / 2, y - forma_H / 2]; }

// W(x) = Σ aᵏ cos(bᵏ π x) on x ∈ [−1, 1], as many terms as 1,600 samples can
// resolve (k up to log_b(N/4)), normalised by Σ|aᵏ| so the graph always fits
// 0.4 of the height. The page's pointer walks the graph back and forth over
// 13 s: Trim Paths again, Start and End a short window apart.
var N = 1600;
var terms = Math.max(2, Math.floor(1 + Math.log(N / 4) / Math.log(p_b)));
var norm = (1 - Math.pow(p_a, terms)) / (1 - p_a);
var pts = [];
for (var i = 0; i <= N; i++){
  var x = i / N * 2 - 1, y = 0;
  for (var k = 0; k < terms; k++) y += Math.pow(p_a, k) * Math.cos(Math.pow(p_b, k) * Math.PI * x);
  pts.push(forma_pt(forma_W * (0.05 + 0.9 * i / N), forma_H * 0.5 - (y / norm) * forma_H * 0.4));
}
createPath(pts, [], [], false);